
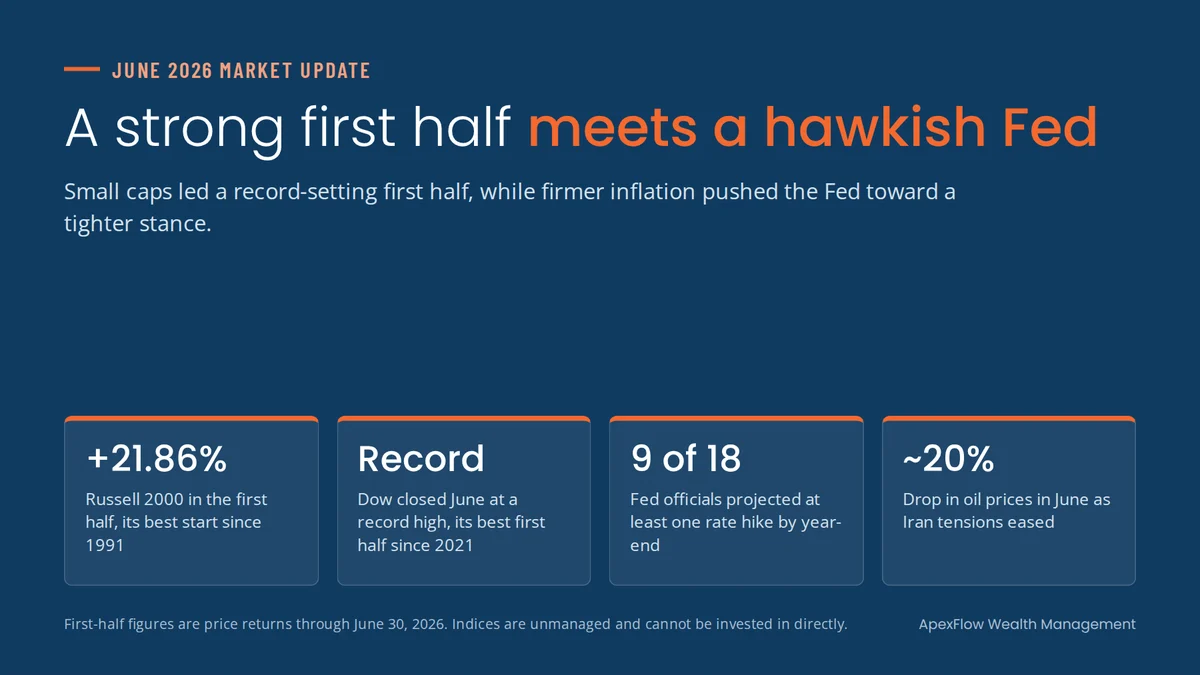
June closed out one of the strongest first halves in years. Small caps had their best start to a year since 1991, the Dow logged its best first half since 2021 and oil prices fell sharply as tensions with Iran eased. At the same time, inflation moved higher and the Federal Reserve, at Chair Kevin Warsh’s first meeting, signaled that its next move could be a hike. In this June 2026 market update, we look at both sides of the picture and what a mid-year check-in should cover.
Key takeaways
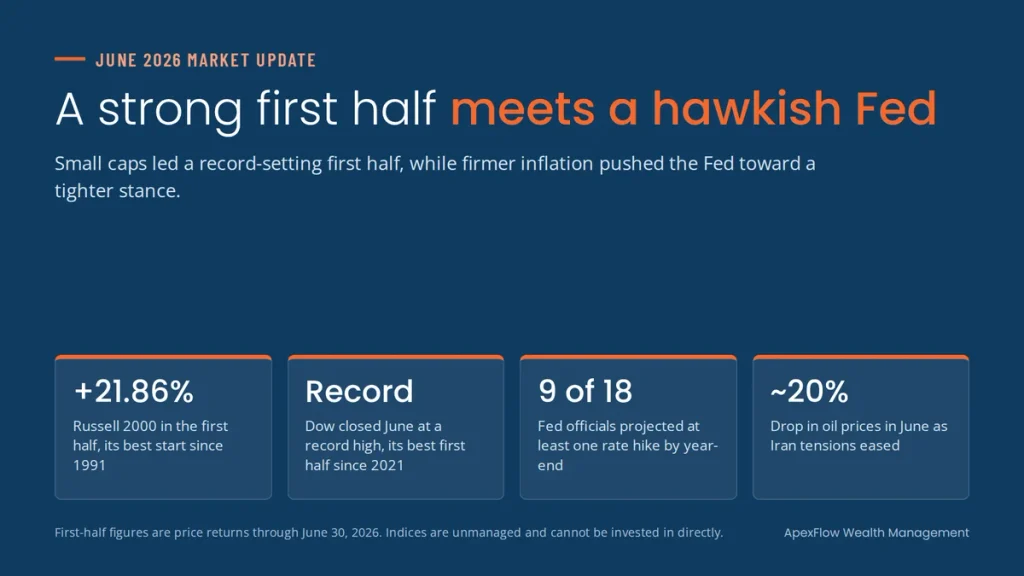
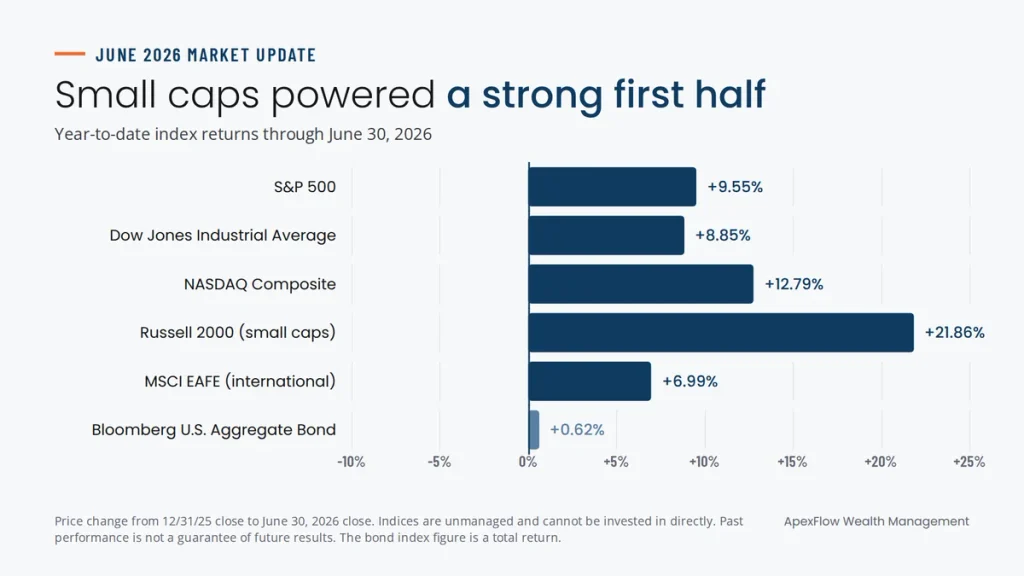
- In the first half, the Russell 2000 rose 21.86%, the NASDAQ 12.79%, the S&P 500 9.55% and the Dow 8.85%.
- June itself was mixed: the Dow gained 2.5% and small caps 3.6%, while the S&P 500 slipped 1.1% and the NASDAQ 2.8%.
- The Fed held rates at 3.50% to 3.75% on June 17 and dropped its bias toward cutting.
- Oil fell roughly 20% in June as an interim ceasefire held and shipping through the Strait of Hormuz returned to normal.
A record-setting first half
The rally that began in April carried through the second quarter. The S&P 500 set its 24th record of the year on June 2, and semiconductor stocks had their best quarter since their index was created in 1993. Analysts’ expectations for 2026 S&P 500 earnings growth climbed to about 23%, up from about 14% at the start of the year.
Leadership kept broadening. Small caps outpaced the S&P 500 by more than 12 percentage points in the first half, and the Dow closed June at a record high. In the final weeks of the month, some of the market’s biggest technology names cooled while other areas picked up the slack.
Year-to-date index returns
| Index | 12/31/25 close | 6/30/26 close | Year-to-date change |
|---|---|---|---|
| Dow Jones Industrial Average | 48,063.29 | 52,319.20 | 8.85% |
| NASDAQ Composite | 23,241.99 | 26,213.72 | 12.79% |
| S&P 500 | 6,845.50 | 7,499.36 | 9.55% |
| MSCI EAFE | 2,892.71 | 3,094.93 | 6.99% |
| Russell 2000 | 2,481.91 | 3,024.37 | 21.86% |
| Bloomberg U.S. Aggregate Bond | 2,348.85 | See note | 0.62%* |
Performance reflects index values as of market close on June 30, 2026. *Bloomberg U.S. Aggregate Bond Index year-to-date total return through June 30, 2026.
Warsh’s first Fed meeting
The Federal Reserve held its target range at 3.50% to 3.75% on June 17 in a unanimous vote, Kevin Warsh’s first meeting as chair. The statement was shorter and no longer leaned toward rate cuts. Officials’ projections shifted too: 9 of 18 showed at least one rate hike by year-end, 8 showed no change and 1 showed a cut.
That shift followed a run of firmer inflation data. The Fed’s preferred measure, the PCE price index, rose 4.1% over the year through May, and core PCE reached 3.4%, its highest since April 2023. The job market stayed steady: employers added 172,000 jobs in May, unemployment held at 4.3% and wages grew 3.4% from a year earlier.
Oil retreats as tensions ease
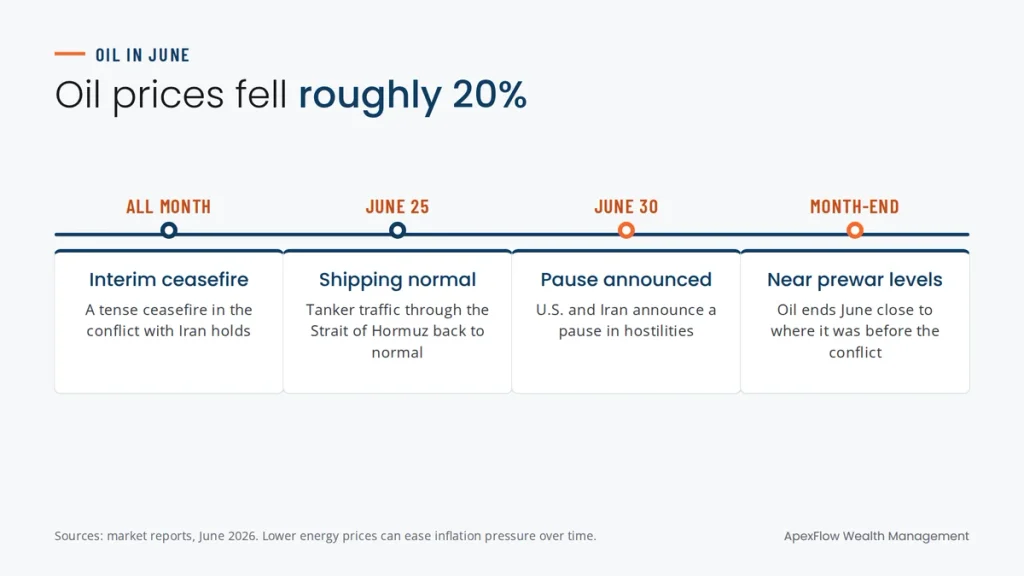
Oil prices fell roughly 20% in June, bringing them close to where they were before the conflict with Iran began. A tense interim ceasefire held, tanker traffic through the Strait of Hormuz returned to normal by late June and the U.S. and Iran announced a pause in hostilities on June 30. Lower energy prices should help ease inflation pressure over time, though the region remains a risk to watch.
Bonds, yields and sentiment
Longer-term Treasury yields eased after an early-month spike. The 30-year yield touched 5.05% on June 8 before ending the month at 4.91%, and the 10-year finished at 4.44%. Higher yields continue to give bonds a meaningful role as a source of income, as we explain in Bonds in Retirement.
Consumers remained gloomy but a bit less so. The University of Michigan’s sentiment index rose to 49.5 in June from a record low of 44.8 in May. On trade, the temporary 10% baseline tariff put in place after February’s Supreme Court ruling was set to expire in late July, and the administration outlined plans to replace it.
What it means for your plan: a mid-year check-in
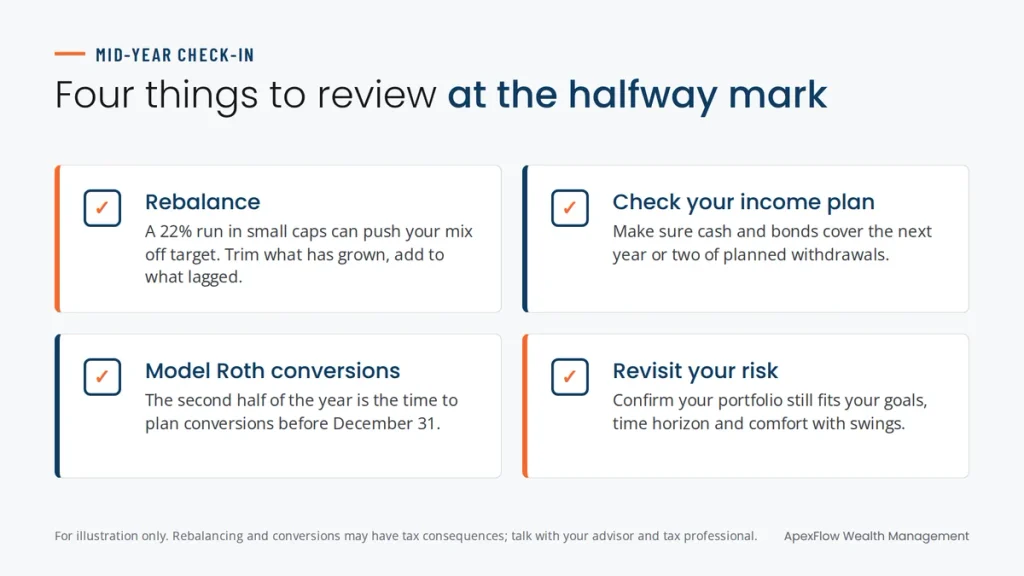
A strong first half is a good time to make sure your portfolio still looks the way you intended. A 22% run in small caps can quietly push an allocation off target, so rebalancing may mean trimming what has done best, the opposite of chasing it. We explain why in Recency Bias in Investing.
Mid-year is also a good time to look at taxes before December arrives. If you’re retired or close to it, the second half of the year is when to model Roth conversions before RMDs, while there’s still time to act.
Talk it through with us
If you’d like a mid-year look at your allocation, your income plan or your tax picture, we’d be glad to help. Book a 20-minute Fit Call. It’s virtual, no prep is needed and there’s no obligation.
With clarity and confidence,
Any opinions are those of ApexFlow Wealth Management and not necessarily those of Raymond James. Expressions of opinion are as of this date and are subject to change without notice. Raymond James and its advisors do not offer tax or legal advice. You should discuss any tax or legal matters with the appropriate professional. Investing involves risk and you may incur a profit or loss regardless of strategy selected, including diversification and asset allocation. Prior to making an investment decision, please consult with your financial advisor about your individual situation. The indices shown are unmanaged and cannot be invested in directly. Index returns do not reflect fees or expenses. Past performance is not a guarantee of future results.